Summary
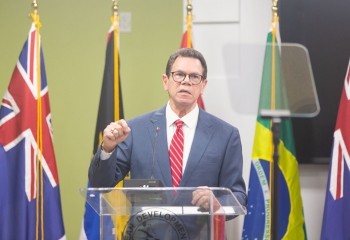
- CLIMATE PROOFING THE WATER SECTOR: INVESTMENT AND FINANCING Dr. Justin Ram Director, Economics Department October 25-27, 2016 Trinidad and Tobago 12th High Level Forum (HLF 12) of Caribbean Ministers Responsible for Water
- Outline • Macro-economic environment • Global importance of water • Caribbean context • The economics of water • Next steps • Opportunity for growth – Water-Jobs Nexus • Financing water investments • The role of CDB
- Average growth of 1.5 % over the past 5 years; high fiscal deficits and growing debt (domestic) 4.2 3.5 3.3 3.4 3.1 3.1 6.3 5.3 4.9 4.6 4.0 4.2 4.9 3.2 3.0 1.3 -0.1 -0.5 1.5 0.9 1.6 2.2 1.4 1.4 2011 2012 2013 2014 2015 2016 GDP Growth World Emerging Markets and Developing Economies Latin America and the Caribbean BMCs Source: WEO, October 2016
- Average growth of 1.5 % over the past 5 years; high fiscal deficits and growing debt (Domestic) 0 20 40 60 80 100 120 140 Antigua and Barbuda Bahamas Barbados Belize Dominica Grenada Guyana Haiti Jamaica St. Kitts and Nevis St. Lucia St. Vincent and the Grenadines Suriname Trinidad and Tobago Debt to GDP (General Government Gross Debt) 2015 2016 Source: WEO, October 2016
- Importance of water
- The importance of water to the global economy Source: Stefan Uhlenbrook, WWAP, UNESCO
- 3 out of 4 jobs that make up the entire global workforce are water dependent WATER-DEPENDENT JOBS Source: Stefan Uhlenbrook, WWAP, UNESCO
- Investing in Water – High Economic Returns Source: Stefan Uhlenbrook, WWAP, UNESCO
- Tariff Structure • Low tariff • Subsidised by Government State Enterprises • Rigid labour contracts (unions) • Low productivity • Focus on operations and maintenance not strategic planning Poor Infrastructure • High inefficiency • High NRW • High demand • Not treated as an economic good Factors affecting the level and quality of water services in the Caribbean
- An average of 47.5 MLD is consumed (exc. T&T) On average 92% of the population has access to water 0 20 40 60 80 100 120 Water Coverage % of Population
- 3 16 102 145 45 19 19 45 43 34 4 137 20 90 27 1,025 11 Anguilla Antigua and Barbuda Bahamas Barbados Belize British Virgin Islands Cayman Islands Dominica Grenada Guyana Monsterrat Jamaica St. Kitts and Nevis St. Lucia St. Vincent & the Grenadines Trinidad and Tobago Turks and Caicos 0 100 200 300 400 500 600 700 800 900 1000 Water Consumption (MLD) An Average of 47.5 MLD is Consumed (Exc. T&T) on Average 92% of the Population has Access to Water
- 0 10 20 30 40 50 60 70 80 NRW % Turks and Caicos Trinidad and Tobago St. Vincent & the Grenadines St. Lucia St. Kitts and Nevis Monsterrat Jamaica Guyana Grenada Dominica Cayman Islands BVI Belize Barbados Bahamas Antigua and Barbuda Anguilla NRW averages 40-50 percent of water generated; Average tariff of USD1.6 per cubic meter
- 3.67 1.7 2.64 1.24 1.82 2.64 2.5 0.4 0.78 0.14 0.66 0.98 0.63 0.37 0.15 0.27 6.6 0 1 2 3 4 5 6 7 Tariff US$/ m³ NRW averages 40-50 percent of water generated; Average tariff of USD1.6 per cubic meter
- Economics of Water Priority areas in water management for investment that will boost the Caribbean’s resilience to climate risks include: Augmenting / identifying alternative water resources Treating and using wastewater as a resource Protecting and restoring watersheds Flood risk management Strengthening water infrastructure and networks Improving water use efficiency
- How does the Caribbean compare – Performance characteristics for public water utilities, 2002 BMC Avg. 6,502,58 7 45.6 1.4 9.6 2.2 89.7 87.1 1.5
- Water sector indicators: Caribbean
- High water consumption – (90% above industry standard) agriculture, tourism and industrial production 0 100 200 300 400 500 600 700 800 Trinidad Dominica Monsterrat BVI St. Lucia Grenada Barbados Water Consumption l/p/c/d Rural Standard Urban Standard
- High water consumption – (90% above industry standard) agriculture, tourism and industrial production 0 5 10 15 20 25 30 35 Antigua & Barbuda Barbados Belize Guyana Jamaica St. Lucia St. Vincent Trinidad & Tobago % of Crop Land Irrigated by Water
- Low water productivity; High operating costs -1 1 3 5 7 9 11 13 15 Water Productivity (Employees/1000 Connections Developed Standard Developing Standard
- Low water productivity; High operating costs 0 0.5 1 1.5 2 2.5 3 3.5 Working Ratio (<0.70 is prudent) Industry Average
- The basic provision of adequate water, sanitation and hygiene (WASH) services at home and in the workplace enables a robust economy by contributing to a healthy and productive population and workforce, with benefit-to-cost ratios as high as 7 to 1 for basic water and sanitation services in developing countries (OECD, 2011a and 2012a). Is water a social good or economic good? United Nations, 2010 (Res 64/292)
- Water and gender-equally important for economic growth Source: United Nations Water Fact Sheet; UN Water.org; (The) World's Women 2010. Trends and Statistics. UNDESA, 2010
- Next steps for the Caribbean Revised Tariff Structures Investment in Infrastructure (PPP) Innovation Financing Management of Watersheds Improving Efficiency Ensuring the Sustainability of Water Resources and Ecosystems Strategic Planning Climate Resilient Water Infrastructure Training and Human Resource Development in Water Resource Management
- Getting incentives right • Through Public Water Utilities, most countries subsidise water, creating incentives for overuse and imposing a fiscal burden; • Subsidies are estimated at approx. 0.6 percent (US$456B) of Global GDP in 2012 (IMF, 2015); • Water subsidies are inequitable, benefiting mostly upper-income groups in developing countries, (IMF, 2015) • Water prices in advanced economies tend to be at or close to cost recovery levels (household and industry); some provide subsidised water for agriculture, electricity generation.
- The case of a bottled water and willingness to pay Global water market was valued at US$170 billion in 2014 Market driven by health awareness and changing consumer lifestyles Demand for clean, hygienic and flavored water; also portability Bottled water is one of the fastest growing industries in the Caribbean
- Bottled water vs Tariffs USD1.03 vs USD0.0003 0.0004 0.0012 0.0003 0.0007 0.0018 0.0001 0.0017 0.0004 0.0008 0.0006 0.0002 0.0026 0.0025 0.0010 0.0000 0.0005 0.0010 0.0015 0.0020 0.0025 0.0030 0.00 1.00 2.00 3.00 4.00 5.00 6.00 7.00 St. Lucia Barbados Trinidad Jamaica Belize Guyana Antigua Dominica Grenada St. Kitts St. Vincent Bahamas Cayman Mosterrat TapWater BottledWater Price of Water (US$ per 1 litre) Bottled Water Tap Water
- Water pricing reforms Tariff structures/ metering 100 96 100 95 28 86 36 70 51 100 4 % OF CUSTOMERS WITH METERS
- Investment in infrastructure development An estimated US$5.5 billion investment in Water and Sanitation is required in the Caribbean (CDB, 2014) Water PPP Experiences in the Caribbean Country Year Started Year Ended Result St. Lucia 2005 & 2008 2009 Failed Bahamas 2012 On- going Positive Results The Bahamas PPP of $83m (10-Year Contract) Goal: Reduce Leaks from The System Performance-Based Contract Daily water loss reduced to half and $6.5 M in savings in the first two (2) years
- Opportunity for growth??? Source: Texas A&M Energy Institute
- Infrastructural investment = Multiplier effect on job creation Source: World Water Assessment Programme (WWAP) & UNESCO, 2016
- The transition to a greener economy enhances opportunity for decent jobs Source: Stefan Uhlenbrook, WWAP, UNESCO
- The Water-Climate Nexus food energy environment urban water
- Climate Finance in the Caribbean Source: Global Water Partnership Caribbean & Caribbean Community Climate Change Centre (Information Brief 3)
- 27% of MDB finance allocated to water and wastewater in 2015 Source: 2015 Joint Report on MDB Climate Finance
- Financing options Tariffs, Taxes, Transfers Government Investment Donor Funding Traditional Sources Climate Funding W/ Water Investment Carbon For Water Green Bonds Social Bonds Innovative Sources
- Sources of financing Source: Assessment of the Water Sector in the Caribbean: Summary Report, Caribbean Development Bank, January 2015
- The role of CDB Green Climate Fund Accreditation; CALC Funding; PPP Facility; Concessional Lending Leader in Climate Change and Water Resource Management Strategic Priority
- Thank You


